Urban Technology at University of Michigan week 215
Interview with Leslie Tom about service design and sustainable museums
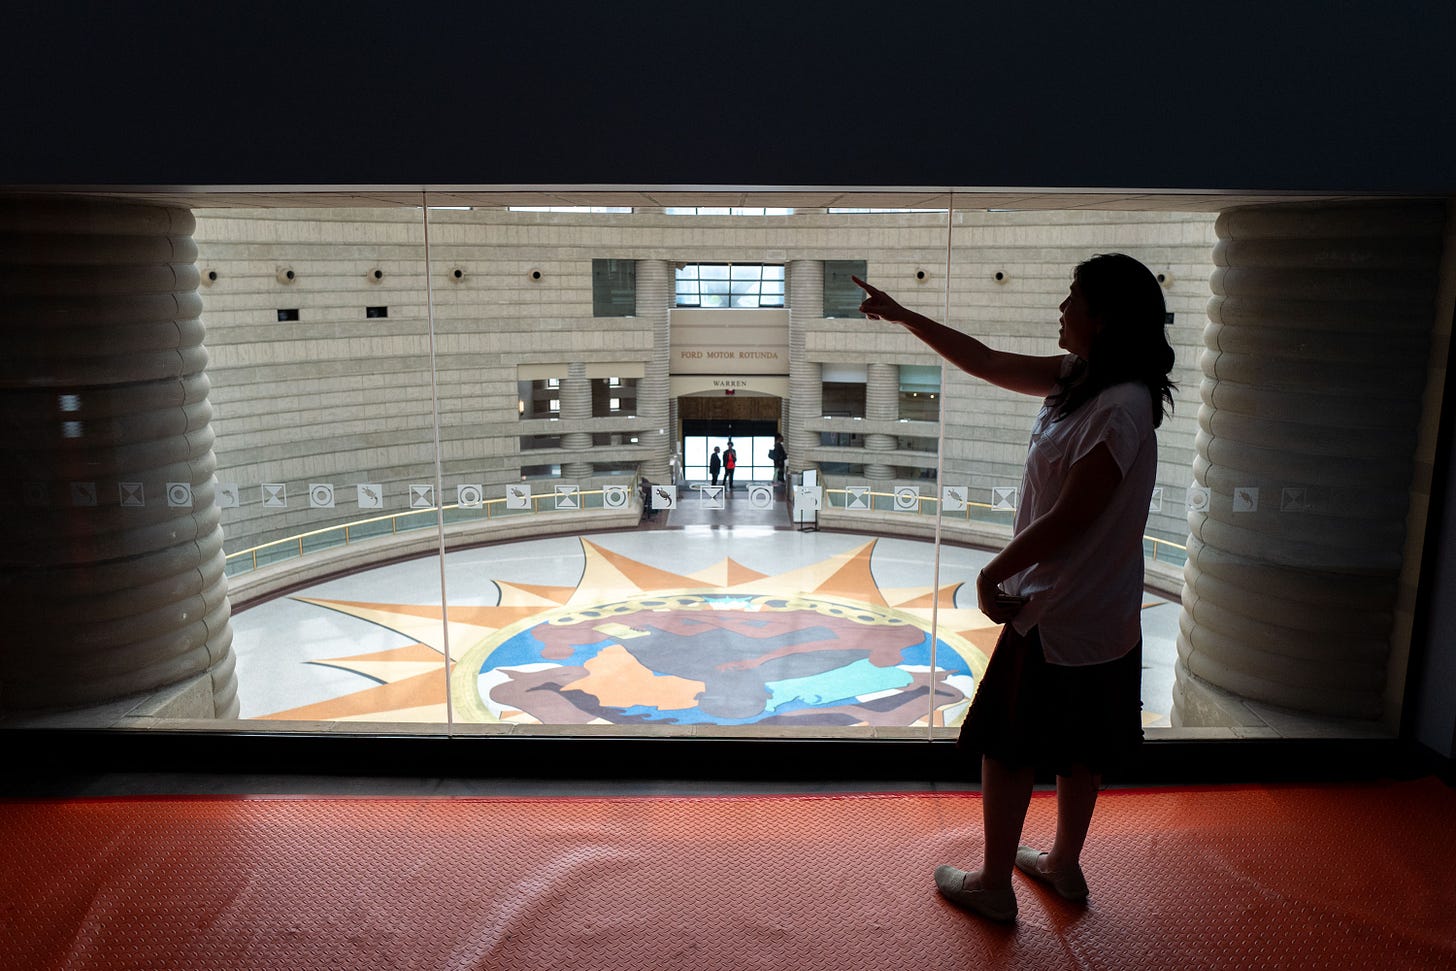
What’s the absolute best room in your entire city? Think about it for a minute. Whether you define that as most grand, calmest, likely to be filled with a parade of well-dressed people, or the one place that has the most comfy seating: it’s a thing. A special room is like being double jointed; great rooms move us.
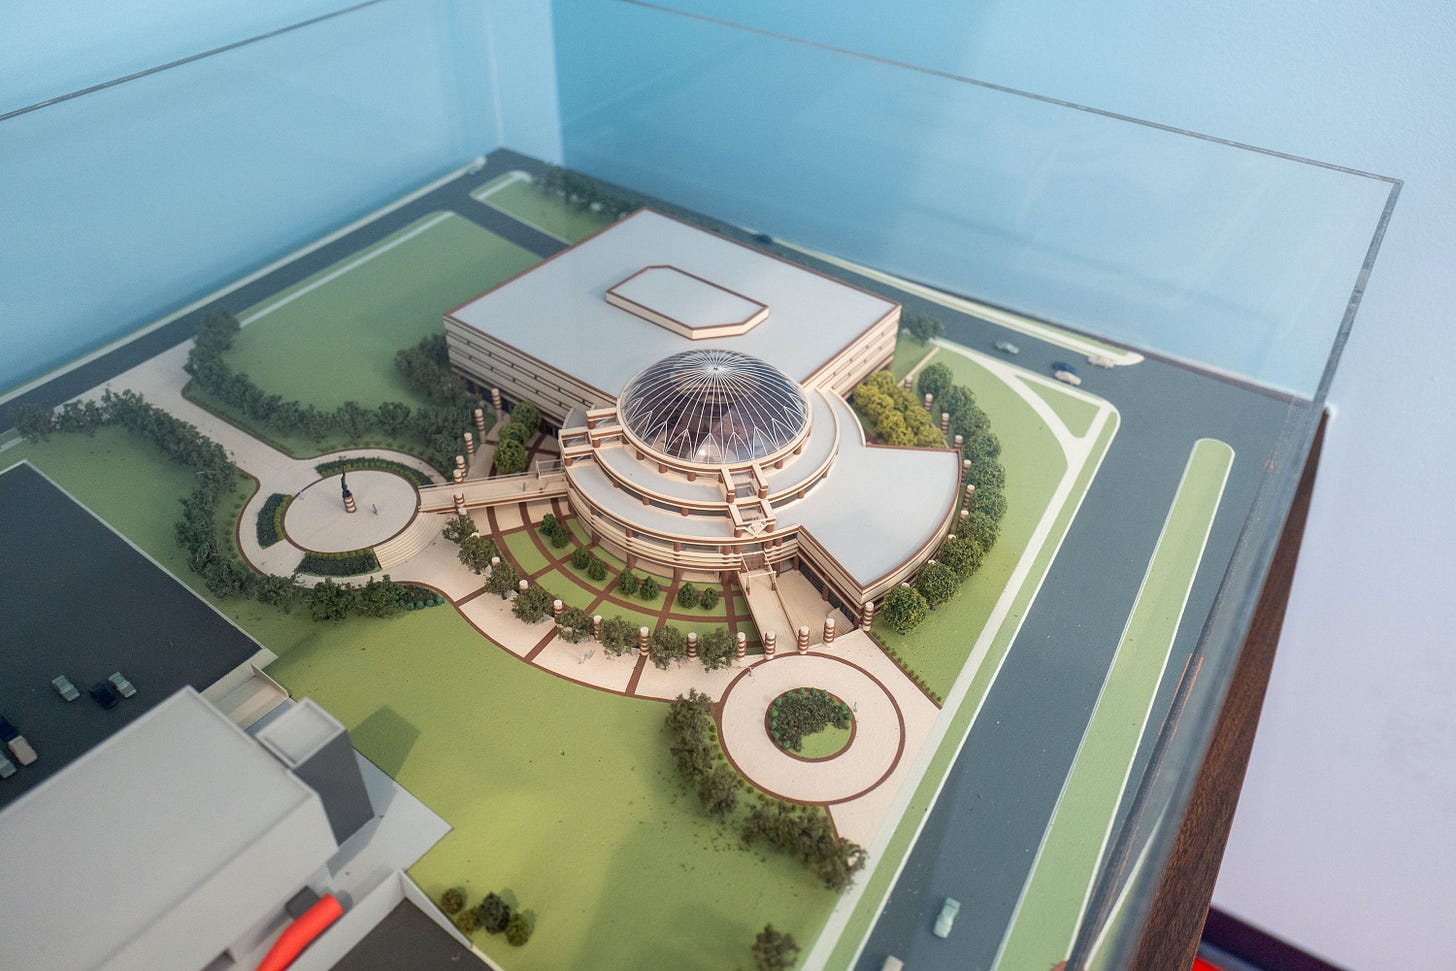
One of the best rooms” or spaces in Detroit is the rotunda at The Charles H. Wright Museum of African American History. It’s soaring, bright, and lovingly overseen by the Museum’s staff. This room is the auspicious setting in which Leslie Tom bounds down the steps from the museum’s administrative offices to start our tour of the work she has been leading there for the past nine years as the museum’s Chief Sustainability Officer. If feedback loops enable the built environment to more carefully arc toward desired outcomes—lower carbon, greater justice, healthier, happier, or all of the above—Leslie Tom’s job is to build those feedback loops, and she does it by encoding them loops digitally and organizationally. Join our tour after the jump.
💬 Hello! This is the newsletter of the Urban Technology program at University of Michigan, in which we explore the ways that data, connectivity, computation, and automation can be harnessed to nurture and improve urban life. If you’re new here, try this short video of current students describing urban technology in their own words or this 90 second explainer video.
♻️ Sustainability & Service Design with Leslie Tom
Leslie is a very UT kind of person. With degrees in architecture and information management she is working “backstage” at the museum to enhance the built and operational systems so that her colleagues can stay focused and stay invested in what matters: creating transformative learning experiences for museum visitors and welcoming the city day in and day out. It started with a simple mandate from the then-CEO: spend less on utilities.
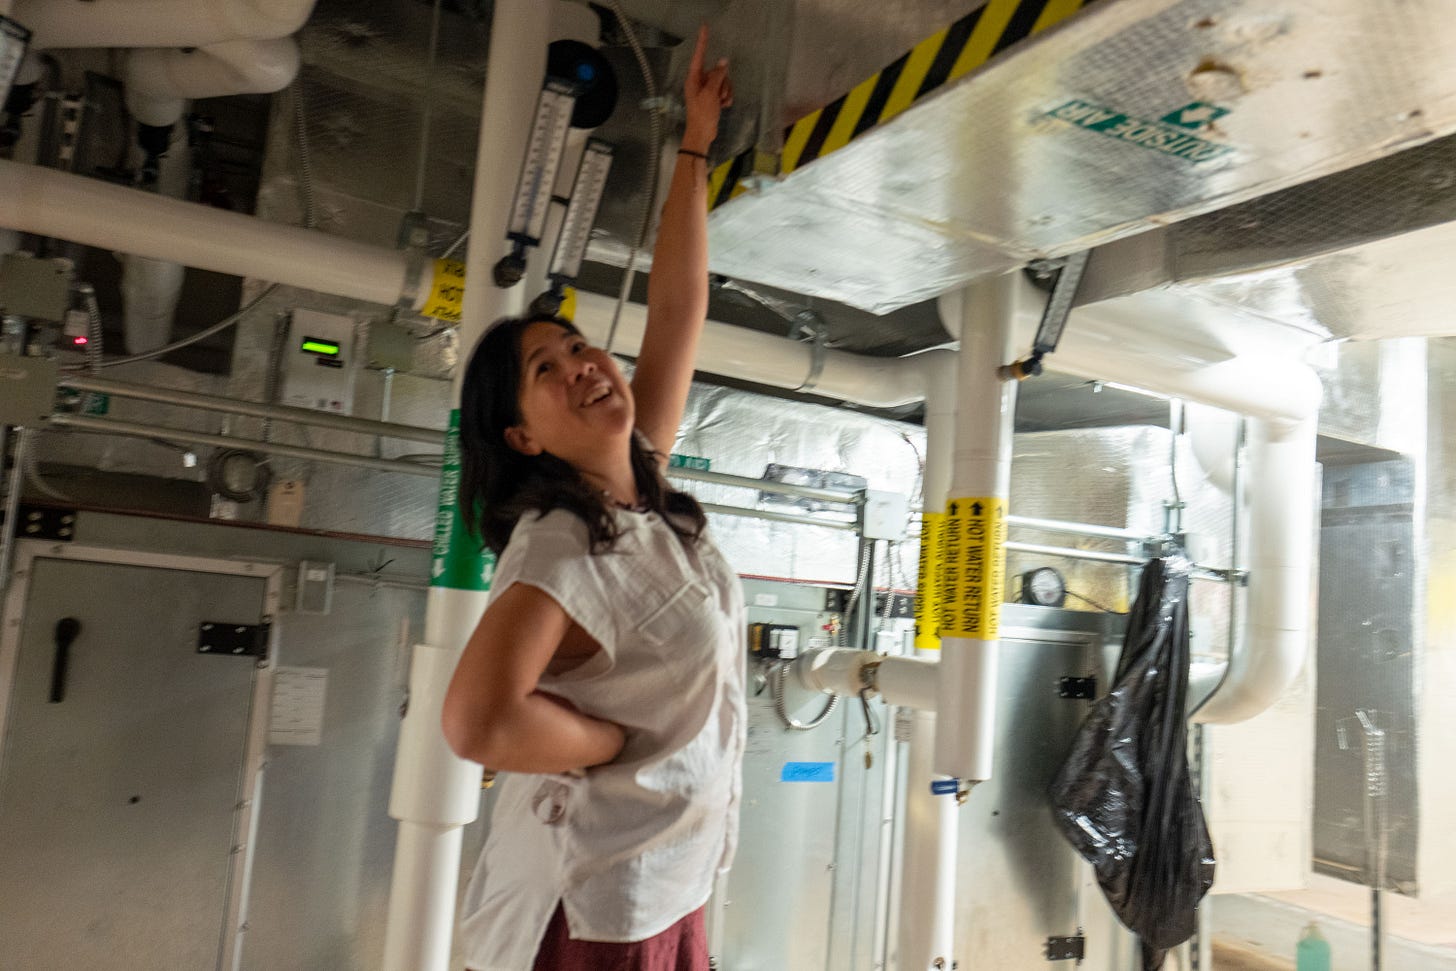
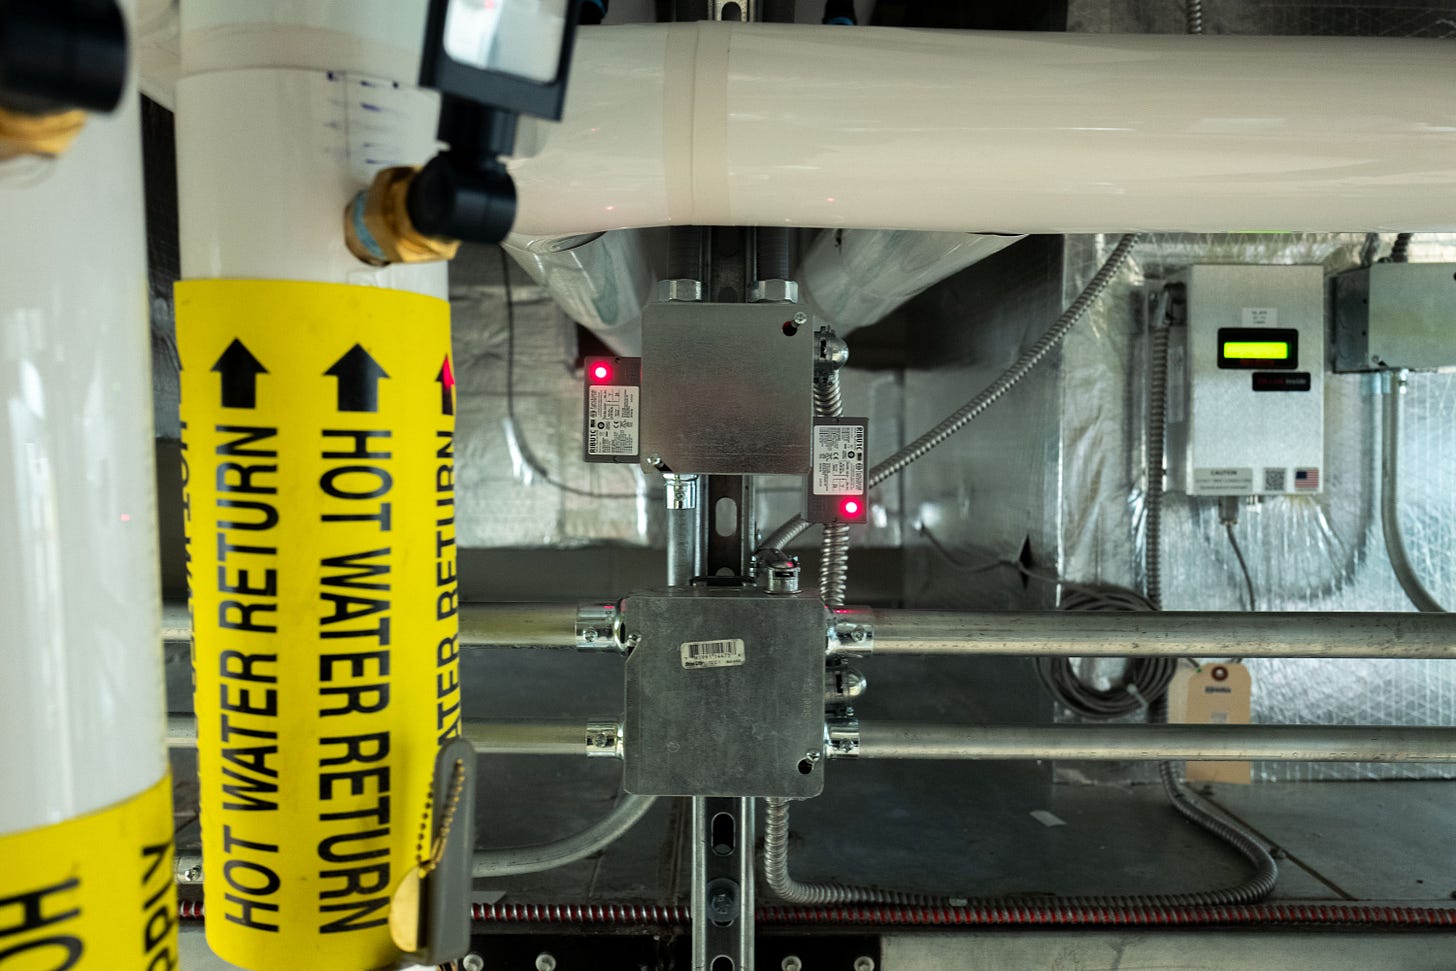
By installing variable fan drives (VFD’s) in 2015 on the heating and cooling system, the museum was able to save $35,000 per year, thanks to a small technical change to the guts of the mechanical room that visitors would never notice. But the museum sure noticed! Saving money on the utility bill meant more funds available for the institution’s core mission of education. Subsequent stormwater infrastructure investments in permeable pavers and rain gardens have enabled the museum to retain now 19,000 gallons of water on site. This is an especially relevant outcome for a museum in Detroit, where stormwater is both very disruptive due to our struggling legacy infrastructure and a costly line item on the water bill.
Technical change comes online with the flick of a switch, but behavioral changes within an organization are harder to enact. Sustainability goals can only be partially met with more efficient equipment. At some point the humans navigating and running the museum have culpability too—their behaviors also tick the carbon footprint of the institution up or down.
That’s why Leslie created the “Green Think Tank Team” of museum staff members and consultants who collaborate on process improvements. Using service design methodologies, for instance, Leslie’s Green Think Tank Team created journey maps of group tours and other types of people who spend time at the museum, as well as the staff experiences that enable this. With this journey map, the contributions of various teams from curation to operations and maintenance are able to share a unified view of the museum’s visitors and how the responsibilities of various museum teams overlap and intersect like leaves in a tree: a single canopy of shade cast by a zillion tiny contributions.

Co-creation in this way is necessarily slow work because it’s the work of building relationships, and Leslie acknowledges that this is the most important work of the museum. So it was when she “sees the maintenance folks with their phone constantly ringing” that Leslie sought to automate the things that can be automated so that the human processes had more time to unfurl. Data would help. “We’re a holistic green museum, so data becomes… just another resource.” In 2015, she set to work trying to build a building information model (BIM) by hand but was stymied by the geometric complexity of the building. In 2019, a laser scan later helped overcome this issue and prepared the museum for being able to create a digital twin using Autodesk’s Tandem platform.
The digital twin of the physical museum enables cross-departmental collaborations with the operations team to perform preventative maintenance, for instance by monitoring air handling units. “When you talk about real sustainability it’s actually this,” Leslie says. The steadfast work of finding simple and direct tweaks throughout the complicated system that is a building (let alone a community) and making improvements. And using sustainability concepts of preventative maintenance, commissioning, and retro-commissioning to measure that new and existing equipment are running at proper working conditions. This extends the intended use of life for mechanical machinery (and its embodied carbon), as well as maintaining operational efficiency. Having a highly detailed 3d model (a level 500 model) useful for facilities management means that “the design team can make their drawings [and other technical documents] super fast” too, connecting the curatorial and exhibition design and fabrication departments. Here’s something cool: less time on documentation means more time on deliberate and designing the educational experience of what’s on display in the museum and why.
As Leslie spins a 3d model around on the Museum’s conference room screen I realize this is the first time I’ve seen someone analyzing a digital twin in realtime. The digital twins used to promote the concept are insanely detailed and full of live data, but the digital twin of a museum applying urban technology is actually modest. Maybe a dozen sensors throughout the building were dribbling their results into a spreadsheet. Some sensors were offline temporarily. It wasn’t all perfect, and I liked it more for that fact because it was the first time I saw through the hype of “digital twins” to understand the simple ways in which having a realtime database of a space and its performance helps everyone level up, including in unexpected ways.
Carbon dioxide sensors used to monitor the health of post-pandemic spaces also, by virtue of being part of a spatial database, describe variations in temperature levels across the interior landscape of the museum. Temperature data acts as a proxy for where people are lingering in the exhibition spaces, allowing curators to understand the rough movement patterns of their guests without the privacy violations or cost of using cameras or more invasive means of collecting data. Now the museum can run A/B tests of their exhibition designs, essentially for free. This is an example of how extra data in the built environment inevitably creates new feedback loops.
Feedback loops can be used to maintain the physical edifice, or to improve user journeys, or in the case of the Wright Museum, both. The combination of new data and new methodologies of co-creation helps enable the museum to dedicate as much of its attention and funding as possible to the mission of educating the public about African American history. Leslie’s work at the museum shows an example of the new roles that are beginning to emerge in places where the “greatness” of a room is not just a question of beauty, but of purpose too.
Here’s a 4-minute video from Autodesk with a bit more discussion of the museum’s digital twin:
🧑🏫 Hiring - Closing Soon!
With the growth of our degree program we have the privilege of growing our teaching faculty too. We currently have two parallel searches for tenure track and practice track professors of any rank to develop field-defining research and teaching in urban technology and design in our Bachelor of Science in Urban Technology program. We're looking for candidates with expertise in design, technology development, and urban and geospatial analytics. If that sounds like you, let's talk?
These weeks: Semester is underway. T-shirts! Warm enough to play football outside, according to the students. Starting to see the Vestaboard updated more often. Studios are humming along. Bring it on, autumn. 🏃


